Answer: See the Explanation for step by step solution.
Explanation:
To configure traffic segmentation on an unconfigured node, you need to run the following
commands on the node:
manage_ovs --bond_name br0-up --bond_mode active-backup --interfaces eth0,eth1
update_uplinks manage_ovs --bridge_name br0-up --interfaces eth2,eth3 --bond_name
bond1 --bond_mode balance-slb update_uplinks
These commands will create a bond named br0-up with eth0 and eth1 as active and
passive interfaces, and assign it to the default bridge. Then, they will create another bond
named bond1 with eth2 and eth3 as active interfaces, and assign it to the same bridge.
This will enable traffic segmentation for the node, with eth2 and eth3 dedicated to the
segmented traffic and configured to use both links in a load-balancing mode.
I have replaced the x in the file Desktop\Files\Network\unconfigured.txt with the appropriate
character or string for you. You can find the updated file in
Desktop\Files\Network\configured.txt.
manage_ovs --bond_name br0-up --bond_mode active-backup --interfaces eth0,eth1
update_uplinks
manage_ovs --bridge_name br1-up --interfaces eth2,eth3 --bond_name bond1 --
bond_mode balance_slb update_uplinks
Answer: See the Explanation for step by step solution.
Explanation:
To create a report named VMs_Power_State that lists the VMs in the cluster and their basic details including the power state for the last month, you can follow these steps:
Log in to Prism Central and click on Entities on the left menu.
Select Virtual Machines from the drop-down menu and click on Create Report.
Enter VMs_Power_State as the report name and a description if required. Click Next.
Under the Custom Views section, select Data Table. Click Next.
Under the Entity Type option, select VM. Click Next.
Under the Custom Columns option, add the following variables: Name, Cluster Name,
vCPUs, Memory, Power State. Click Next.
Under the Time Period option, select Last Month. Click Next.
Under the Report Settings option, select Monthly from the Schedule drop-down menu.
Enter admin@syberdyne.net as the Email Recipient. Select CSV as the Report Output
Format. Click Next.
Review the report details and click Finish.
To generate an instance of the report named VMs_Power_State as a CSV and save the zip
file as Desktop\Files\VMs_Power_state.zip, you can follow these steps:
Log in to Prism Central and click on Operations on the left menu.
Select Reports from the drop-down menu and find the VMs_Power_State report from the
list. Click on Run Now.
Wait for the report to be generated and click on Download Report. Save the file as
Desktop\Files\VMs_Power_state.zip.
1.Open the Report section on Prism Central (Operations > Reports)
2.Click on the New Report button to start the creation of your custom report
3.Under the Custom Views section, select Data Table
4.Provide a title to your custom report, as well as a description if required.
5.Under the Entity Type option, select VM
6.This report can include all as well as a selection of the VMs
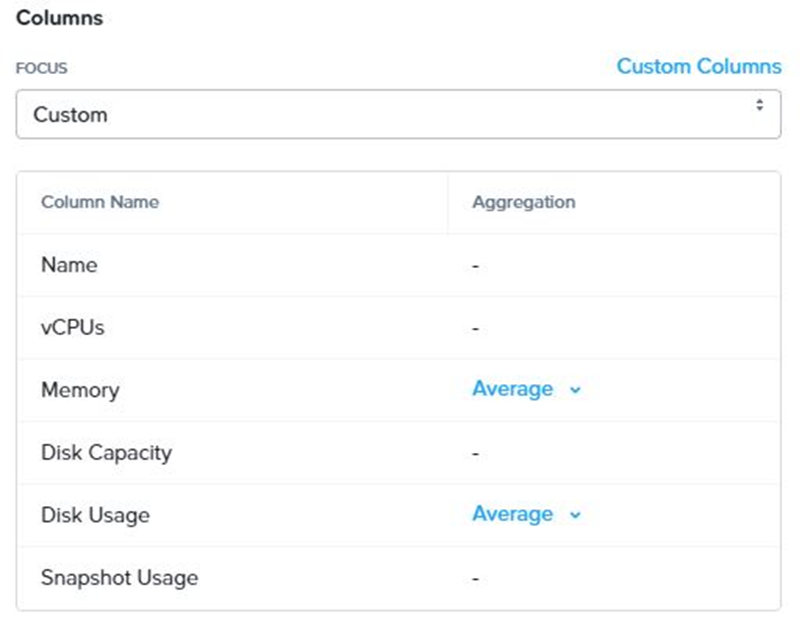
7.Click on the Custom Columns option and add the below variables:
a.Name - Name of the listed Virtual Machine
b.vCPUs - A combination of the vCores and vCPU's assigned to the Virtual Machine
c.Memory - Amount of memory assigned to the Virtual Machine
d.Disk Capacity - The total amount of assigned virtual disk capacity
e.Disk Usage - The total used virtual disk capacity
f.Snapshot Usage - The total amount of capacity used by snapshots (Excluding Protection
Domain snapshots)
8.Under the Aggregation option for Memory and Disk Usage accept the default Average
option

9.Click on the Add button to add this custom selection to your report
10.Next click on the Save and Run Now button on the bottom right of the screen
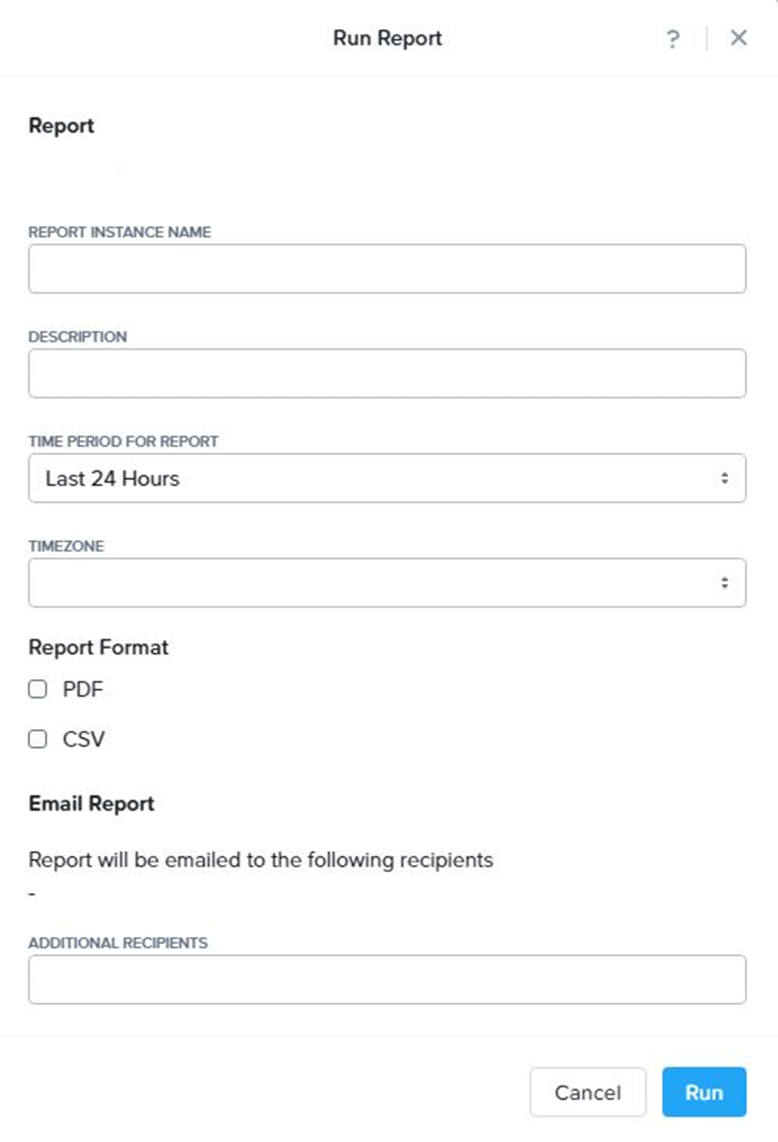
11.Provide the relevant details on this screen for your custom report:

12.You can leave the Time Period For Report variable at the default of Last 24 Hours
13.Specify a report output of preference (PDF or CSV) and if required Additional Recipients
for this report to be mailed to. The report can also simply be downloaded after this creation
and initial run if required
Answer: See the Explanation for step by step solution.
Explanation:
To configure the environment to satisfy the requirement of implementing a security policy
named Staging_Production, such that no VM in the Staging Environment can communicate
with any VM in the production Environment, you need to do the following steps:
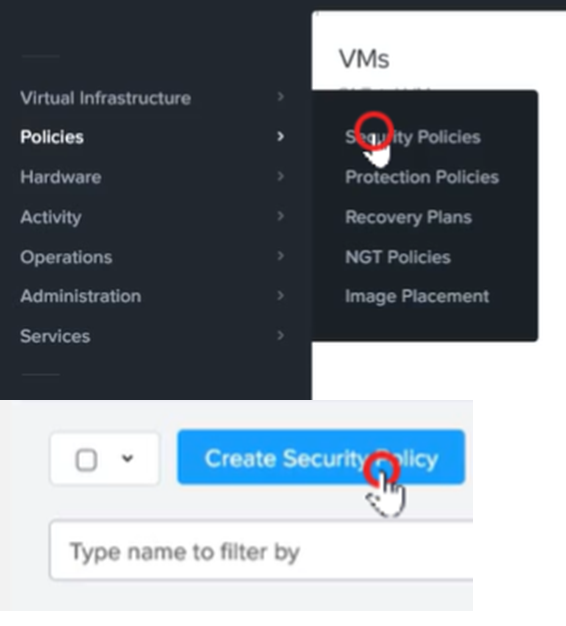
Log in to Prism Central and go to Network > Security Policies > Create Security Policy.
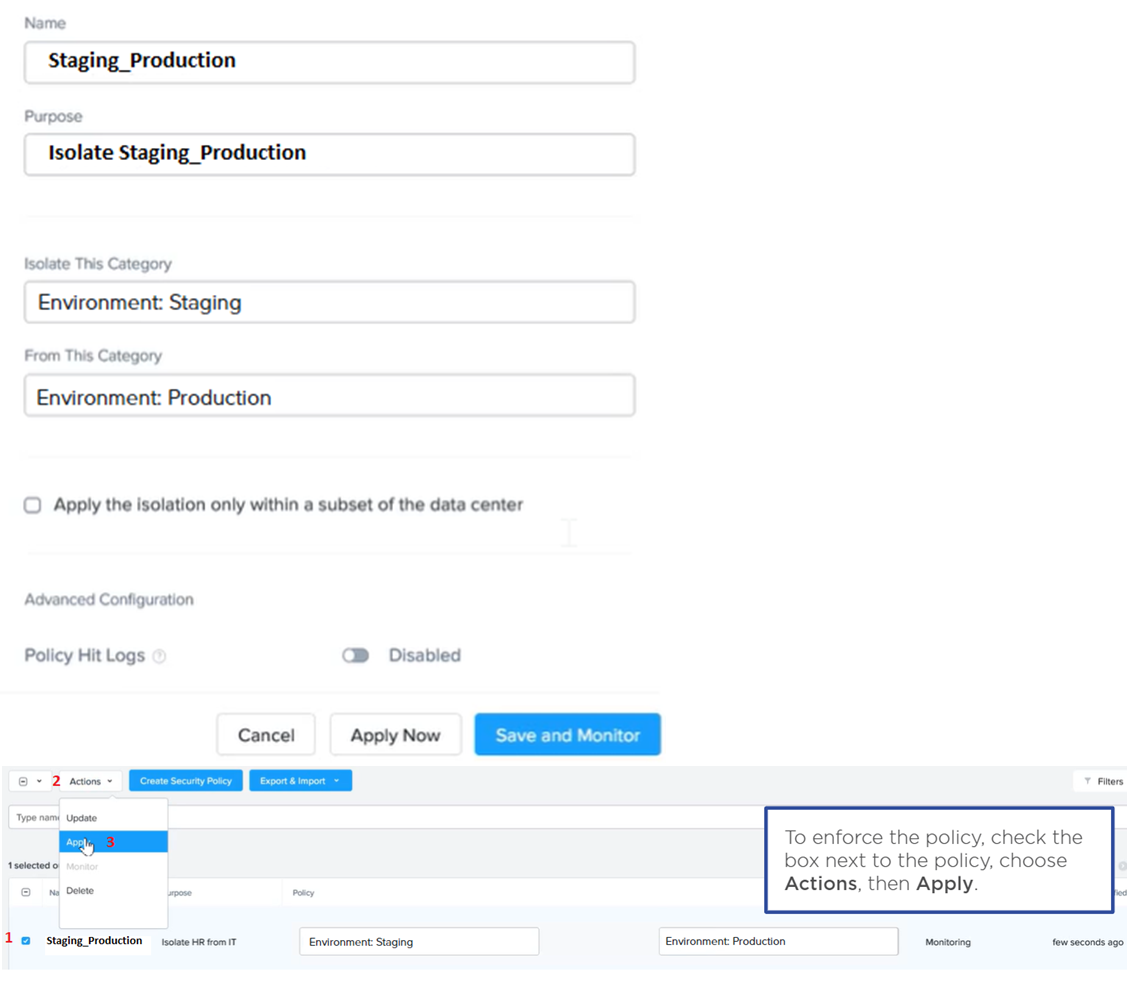
Enter Staging_Production as the name of the security policy and select Cluster A as the
cluster.
In the Scope section, select VMs as the entity type and add the VMs that belong to the
Staging Environment and the Production Environment as the entities. You can use tags or
categories to filter the VMs based on their environment.
In the Rules section, create a new rule with the following settings:
Direction: Bidirectional
Protocol: Any
Source: Staging Environment
Destination: Production Environment
Action: Deny
Save the security policy and apply it to the cluster.
This will create a security policy that will block any traffic between the VMs in the Staging
Environment and the VMs in the Production Environment. You can verify that the security
policy is working by trying to ping or access any VM in the Production Environment from
any VM in the Staging Environment, or vice versa. You should not be able to do so.


Answer: See the Explanation for step by step solution.
Explanation:
To restore the VM and ensure it is reachable on the network, you can follow these steps:
Log in to the Web Console of the cluster where the VM is running.
Click on Virtual Machines on the left menu and find Cent_Down from the list. Click on the
power icon to power off the VM.
Click on the snapshot icon next to the power icon to open the Snapshot Management
window.
Select a snapshot from the list that was taken before the network stack was corrupted. You
can use the date and time information to choose a suitable snapshot.
Click on Restore VM and confirm the action in the dialog box. Wait for the restore process
to complete.
Click on the power icon again to power on the VM.
Log in to the VM using SSH or console with the username and password provided.
Run the command ping 172.31.0.1 to verify that the VM is reachable on the network. You
should see a reply from the destination IP address.
Go to VMS from the prism central gui
Select the VMand go to More -> Guest Shutdown
Go to Snapshots tab and revert to latest snapshot available
power on vm and verify if ping is working


